


Part 5 of 5.
Thank you for reading this post, don't forget to subscribe!Four posts of reasons are enough. This one is about what it looks like when you actually use the thing, and about the name, which people ask about more often than they ask about normalization. Fair enough.
One small note first. The command examples below use the usual command line options, and those start with two little lines. The prose around them does not. That is a personal style choice and I am sticking to it.
Installing
On any Linux or macOS machine with Python 3.12:
uv venv && uv pip install simurg-2.0.0-py3-none-any.whl
 simurg --help
If you have a C compiler and Rust, you can add the optional kernels, which make the heavy steps about three times faster and produce exactly the same bytes:
uv pip install ./rust/simurg-core
 python -c "from simurg._core import backend; print(backend())"
There is also a Docker image and a conda recipe. The user guide covers all of them.
A first look at your files
Before running anything, it helps to know what you have. simurg inspect reads any IDAT, manifest, cluster file, GTC or sample sheet and prints what is inside:
simurg inspect idats/204112350001_R01C01_Grn.idat
 simurg inspect GSA.bpm GSA.egt --json
This is surprisingly useful. It will tell you, for instance, that your cluster file was made for a different manifest version than your chips, which is the kind of thing you would rather know on day one.
From IDAT to genotypes
The main event. One command reads the IDATs, normalizes them, calls genotypes against the cluster file, writes a GTC per sample, and runs the sample and control QC:
simurg genotype --bpm GSA.bpm --egt GSA.egt --csv GSA.csv \
     --idats idats/ --sheet SampleSheet.csv --out run/gtc --threads 0
threads 0 means “use every core”. On a Raspberry Pi 5 that is four, which is plenty for a few dozen samples while you make tea.
What you get:
- one GTC file per sample, identical to what the vendor’s command line tool would produce with the same inputs,
- sample_summary.tsv with call rates, LogR deviation, sex estimates and flags,
- control probe metrics, contamination estimates and a relatedness table for the batch,
- a run_manifest.json that records every version, checksum and option used.
Looking at the QC
simurg qc report --data run/gtc --out run/qc_report --output-format both
This writes a single HTML file you can email to a colleague, plus a spreadsheet. The report has linked views: select an odd looking sample in the call rate plot and it lights up in the control metrics, the sex check and the chip layout. There is a thresholds editor, so you can move a cutoff and see which samples fail before you commit to it.
My favorite part is the chip heatmap. When a whole row of a BeadChip fails together, you stop blaming the DNA and start asking about the scanner.
To VCF and beyond
simurg gtc-to-vcf --bpm GSA.bpm --csv GSA.csv --fasta GRCh38.fa --gtcs run/gtc --out run/vcf
 simurg export plink --vcfs run/vcf --gtcs run/gtc --out run/plink --format both
The VCFs are on the plus strand, validated with bcftools, and agree with gtc2vcf and GTCtoVCF apart from a documented list of cases where one of them cannot resolve an insertion or deletion probe. PLINK 1 and PLINK 2 files come out identical to what plink2 itself produces from the same VCFs.
Copy number, LOH and mosaicism
Build a model once per chip and batch, from at least 24 normal samples, then call:
simurg cn build-model --bpm GSA.bpm --fasta GRCh38.fa --egt GSA.egt \
     --reference-gtcs normals/ --out gsa.simurg-cyto
 simurg cn call --bpm GSA.bpm --model gsa.simurg-cyto --gtcs run/gtc --fasta GRCh38.fa --out run/cn
 simurg cn annotate --vcfs run/cn
Each sample gets a CNV VCF with deletions, duplications, LOH and mosaic events, a segments file, and ISCN style descriptions with cytobands and genes. The sample summary flags arrays with far too many events. On the public validation set, exactly one array raised that flag, and it deserved it.
Pharmacogenomics
Build the database from open sources, check what your array can actually see, then call:
bash scripts/pgx/fetch_sources.sh
 simurg pgx db build --sources data/pgx/sources --fasta GRCh38.fa \
     --manifests GSA_PGx.bpm --csv GSA_PGx.csv --out pgxdb/
 simurg pgx coverage --bpm GSA_PGx.bpm --db pgxdb/pgx_db.sqlite
 simurg pgx copy-number call --gtcs run/gtc --model cnmodel/GSA_PGx.simurg-pgxcn --fasta GRCh38.fa --out run/vcf
 simurg pgx star-allele call --vcfs run/vcf --db pgxdb/pgx_db.sqlite --out run/pgx
 simurg pgx phenotype --calls run/pgx --db pgxdb/pgx_db.sqlite
The coverage step is the one I would not skip. It tells you, before you look at a single sample, which alleles your array can distinguish and which it cannot. A lot of confusion about array PGx comes from asking a chip a question it was never able to answer.
For each sample you get a diplotype summary, the supporting variants, the variants that were not covered, alternative diplotypes the array cannot tell apart, and a JSON file with the phenotype and the evidence. For research, as always.
Training your own cluster file
simurg train --gtcs cohort_gtc --bpm GSA.bpm --out mycohort.egt
 simurg genotype --bpm GSA.bpm --egt mycohort.egt --idats new_idats/ --out run2/gtc
A hundred samples is the minimum. Training reads raw intensities, not genotypes, so it does not matter which cluster file your cohort was first called with. On the Pi, 120 GSA samples take a bit over an hour. I usually start it and go to bed, which is also how most of this project got done.
Checking one run against another
simurg compare run/gtc other_run/gtc --out compare_report
Every field of every GTC or VCF is compared and labelled EXACT, NEAR, DISCREPANCY or UNKNOWN, with an HTML dashboard. This is the tool I used to build everything else, and it is the one I would miss most.
About the name
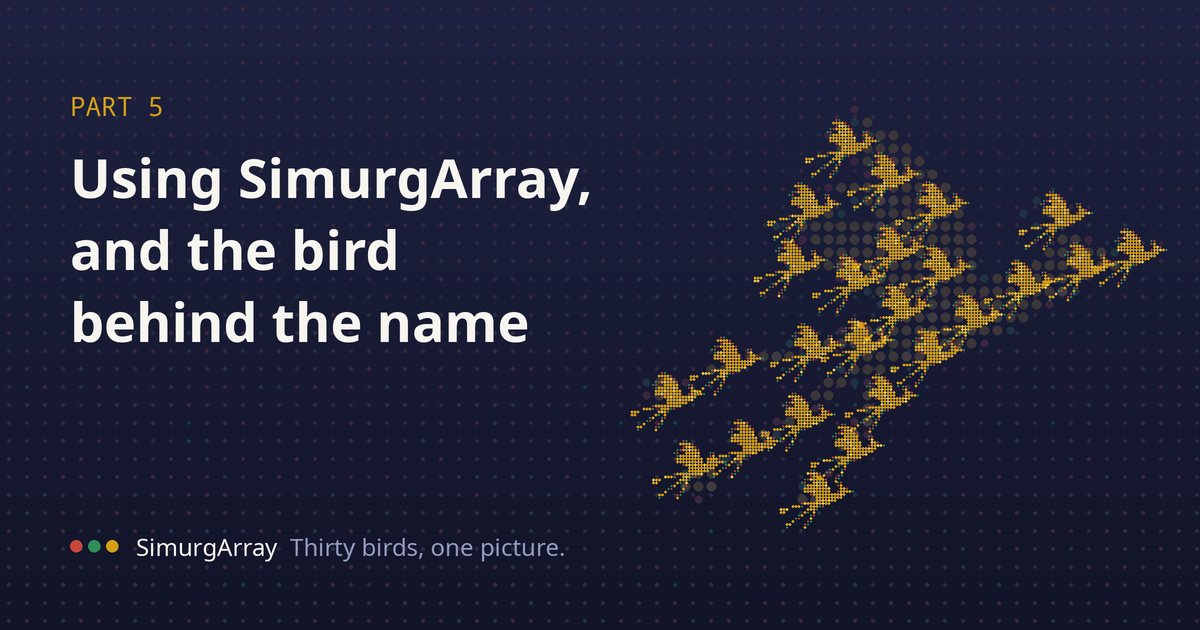
In Persian and Turkic mythology the Simurg (Simurgh, Simorgh, depending on who is telling the story) is a great bird, old and wise, that lives on a mountain at the edge of the world. In Attar’s twelfth century poem The Conference of the Birds, the birds of the world set out to find the Simurg and make it their king. Most give up along the way. When the survivors finally arrive, there are thirty of them, and they discover that “si murg” means “thirty birds”. The Simurg they were looking for was themselves, together.
I liked the name because an array is exactly that: hundreds of thousands of tiny beads that only make sense once you look at them together. Then something happened that I did not plan. The public demo dataset I used for the pharmacogenomics validation was sold as 36 samples. When I checked identities against 1000 Genomes, it turned out to be 30 individuals.
Thirty birds. I took it as a sign that I had picked the right name, or at least a sign that I should stop looking for signs and get back to work.
Branding
A tool for researchers does not need a marketing department, but it does need to be recognizable and consistent. Here is what I have settled on.
Name. SimurgArray in writing, simurg on the command line. Short to type, hard to mistype, and it does not collide with any genomics tool I know of.
Tagline. “Thirty birds, one picture.” It is the whole idea in four words: many small signals, one honest result.
Logo. A bird in flight drawn only with dots on a square grid, the way beads sit on a BeadChip. The dots use the two scanner channels, red and green, and where they overlap the bird turns gold. It should work at 16 pixels as a favicon and at poster size, and it should look a little like a genotype cluster plot if you squint. People who work with arrays will squint.
Colors.
- Channel red #C8453A
- Channel green #2F8F5B
- Simurg gold #D4A017 for highlights and the bird
- Night indigo #1E2240 for backgrounds, because most of the work happened at night
- Paper #F7F5EF for documents
Type. A clean sans serif for text and a monospace font for anything you might paste into a terminal. Numbers in reports always use tabular figures, so columns of call rates line up.
Voice. Plain, exact and a little dry. Say what the software does, show the number, name the limitation in the same paragraph. No “revolutionary”, no “AI powered”, no promises about medicine. If a result has a caveat, the caveat goes next to the result, not in a footnote.
Reports. Every HTML report carries the small dotted bird in the corner, the software version and the run manifest checksum. The bird is there for recognition. The checksum is there because the bird cannot prove anything on its own.
Thank you
If you have read all five posts, you now know more about SimurgArray than most of the machines it has run on. The code goes public on the calendar from the previous post. Until then, if you work with arrays and want to try it, or want to tell me which of my choices are wrong, I would be glad to hear from you.
The birds made it to the mountain. Now the interesting part starts.