


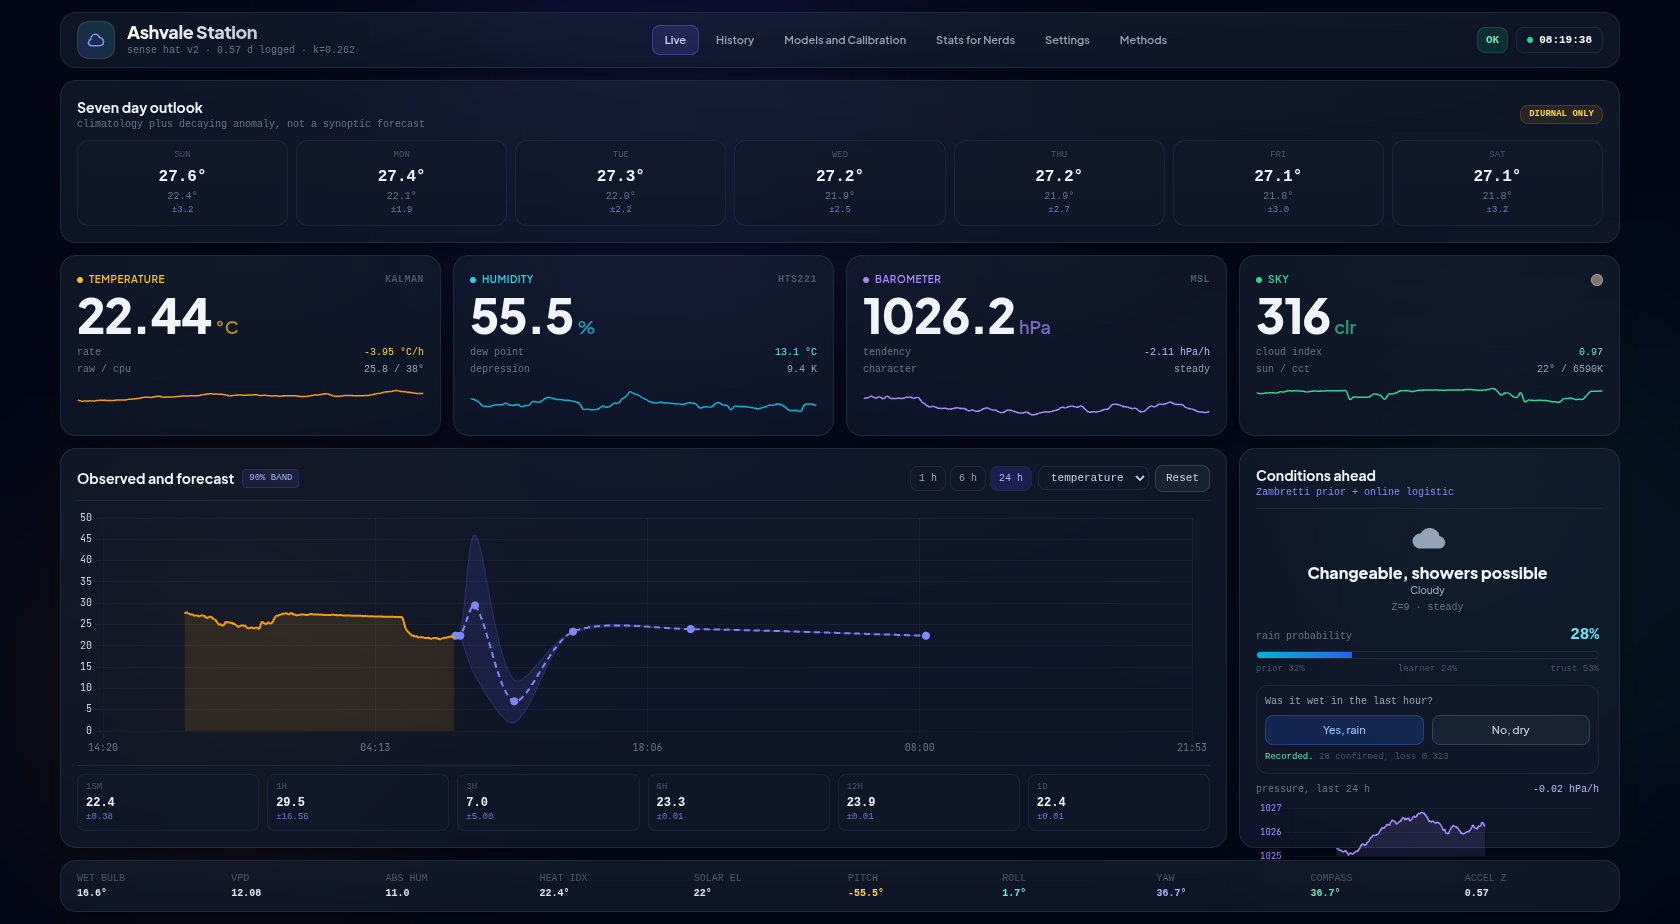
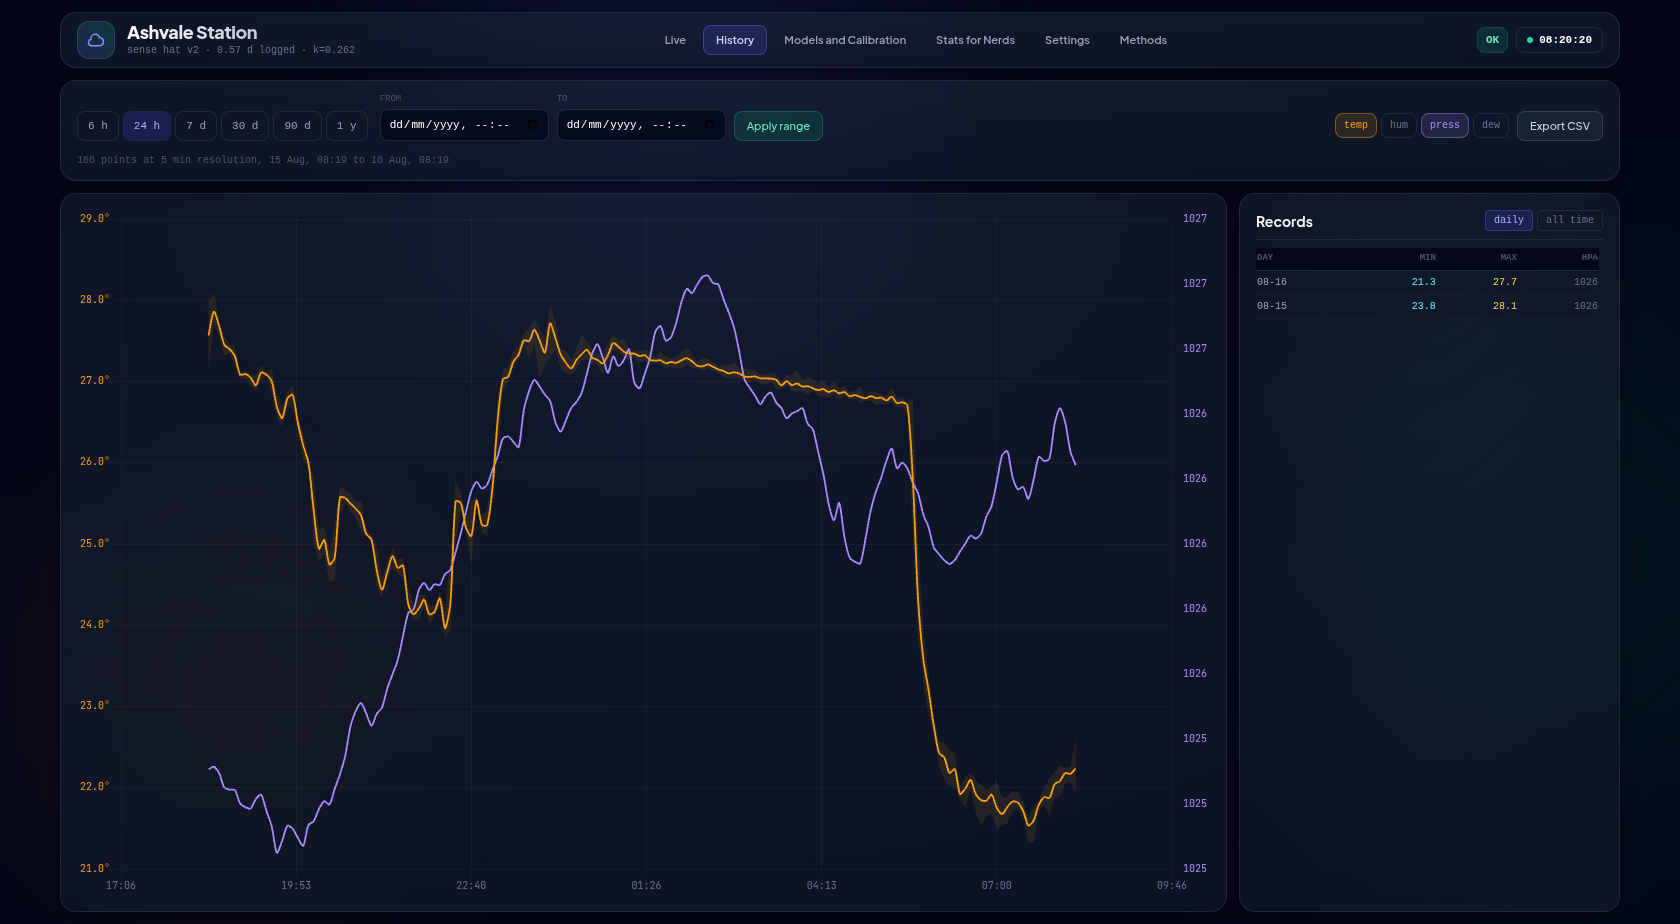
A Raspberry Pi Zero 2 W paired with a Sense HAT V2 runs a fully self-contained, edge-native machine learning weather station with no cloud, GPU, or heavy ML frameworks. The system uses pure NumPy implementations of Recursive Least Squares, Kalman filtering, conformal prediction, and drift detection, staying under 150 MB RAM.
Thank you for reading this post, don't forget to subscribe!The station continuously updates its own statistical model of local atmospheric conditions, produces calibrated uncertainty intervals, and renders animated forecasts on the HAT’s 8×8 LED matrix. The project is open source and available on GitHub.
Those who know me know that I’m a die-hard Raspberry Pi fan.
So when I found a Raspberry Pi Sense HAT V2 sitting around for far too long, waiting patiently to be useful, I started asking myself:
“What can I actually make this thing do?”
The answer turned out to be considerably more ambitious than I expected.
I decided to build an edge-native machine learning weather station around a Raspberry Pi Zero 2 W — not just something that measures temperature, humidity and pressure, but something that actually learns from its environment and forecasts what may happen next.
And I wanted to push the constraints as hard as possible.
No cloud.
No GPU.
No PyTorch.
No scikit-learn.
No pandas.
Everything runs on the Pi.
The learners are implemented in pure NumPy, and the entire system comfortably stays under 150 MB RSS.
That constraint completely changes how you approach machine learning.
Instead of throwing a huge model at the problem, I built a lightweight online-learning architecture designed around the physics, statistics and structure of the data.
The pipeline combines:
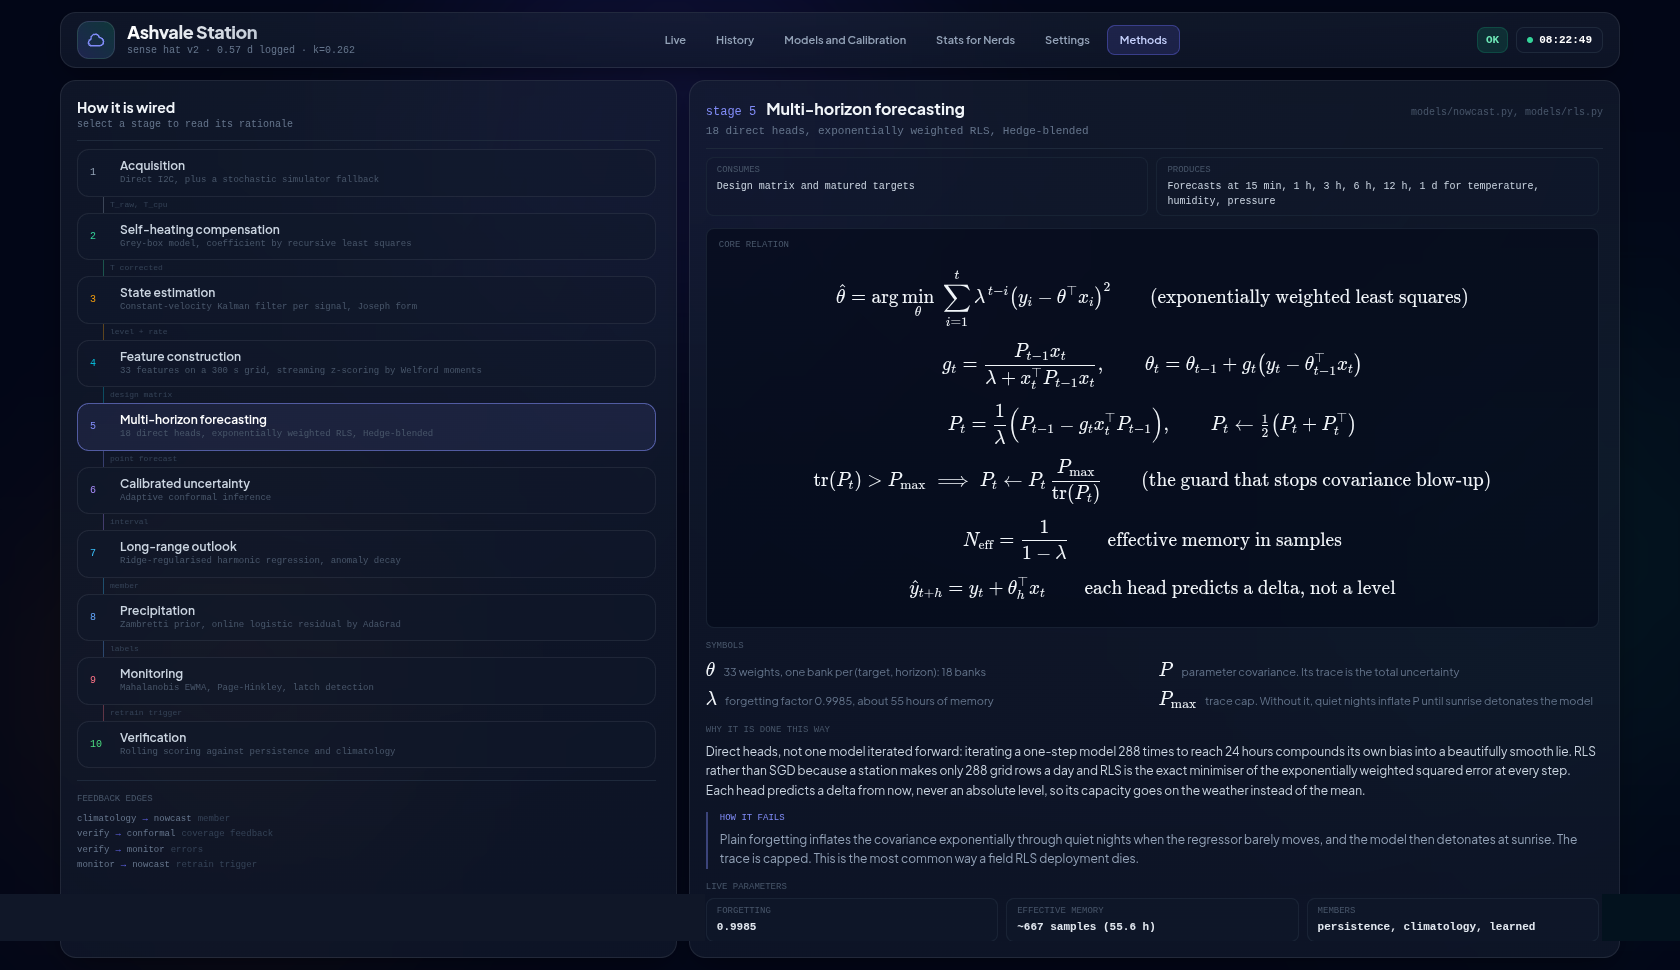
Recursive Least Squares (RLS) for continuously adapting the forecasting models, with multiple independent heads covering different targets and forecast horizons.
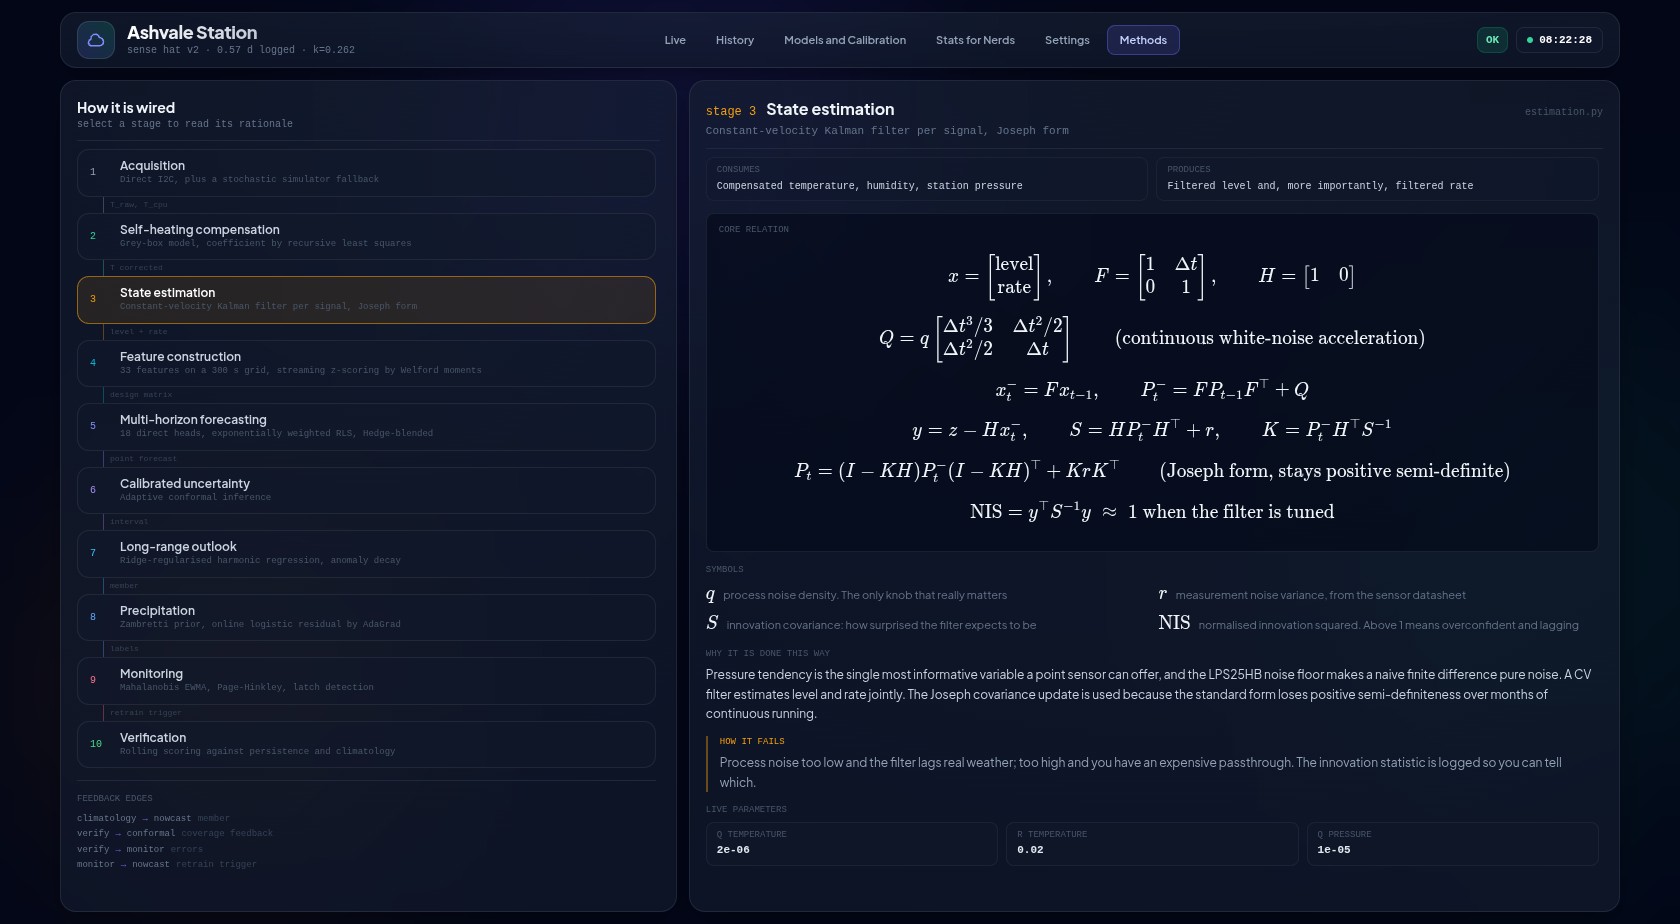
Kalman filtering for estimating the underlying weather state while separating actual changes from sensor noise.
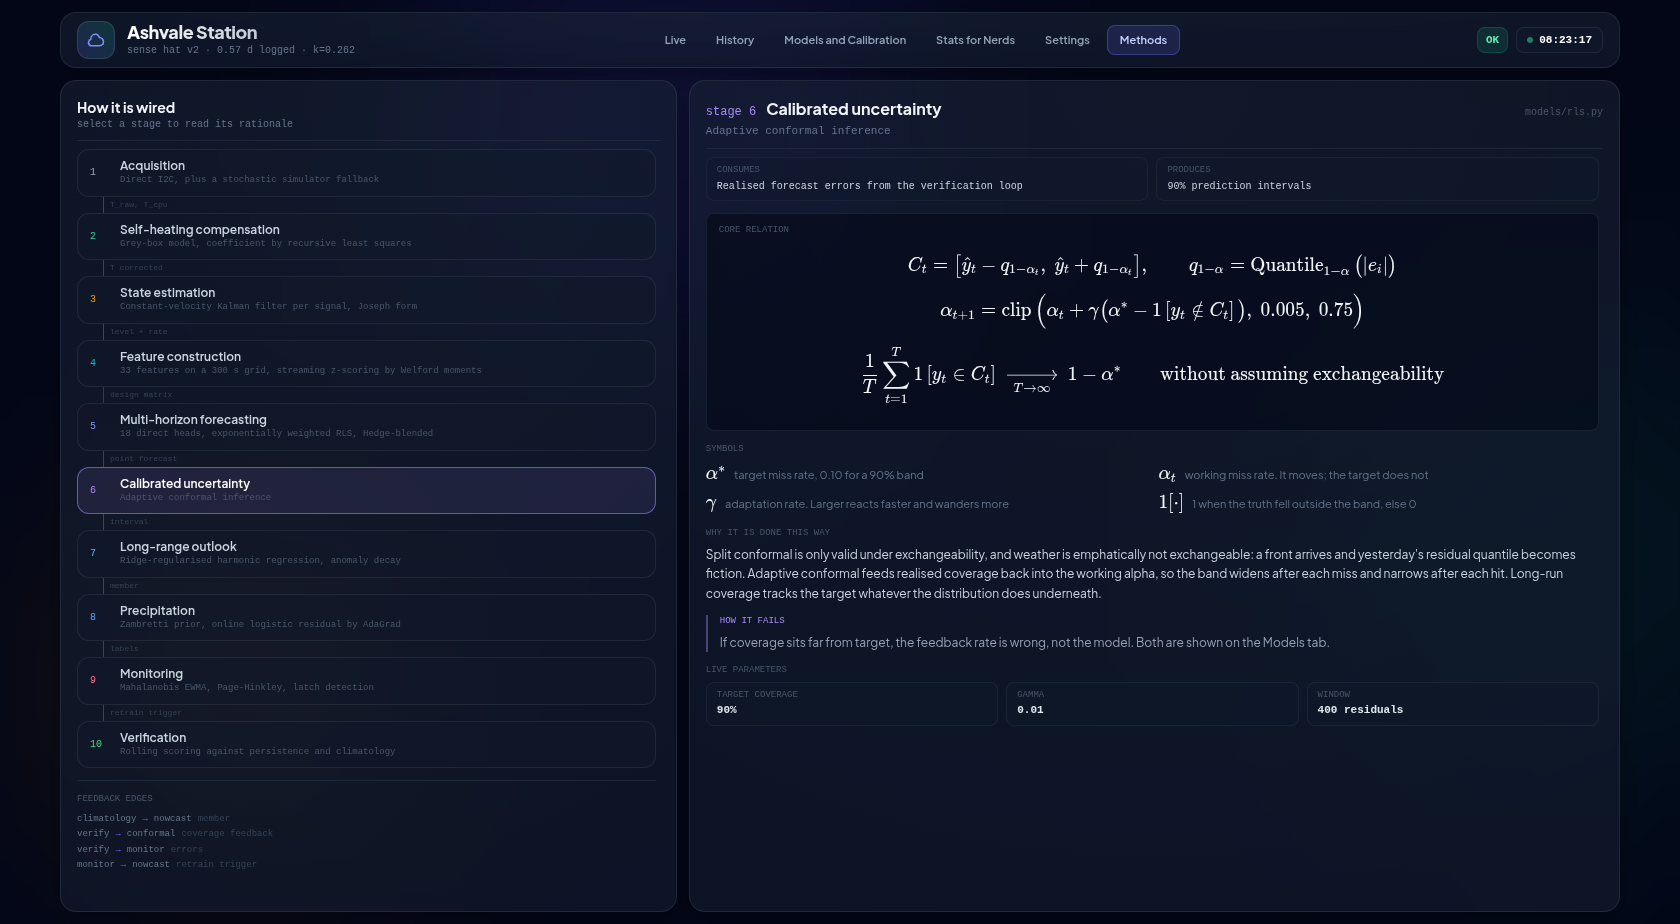
Conformal prediction to produce calibrated uncertainty intervals — so the system doesn’t just say “I predict 18.4°C”, but also communicates how uncertain that prediction is.
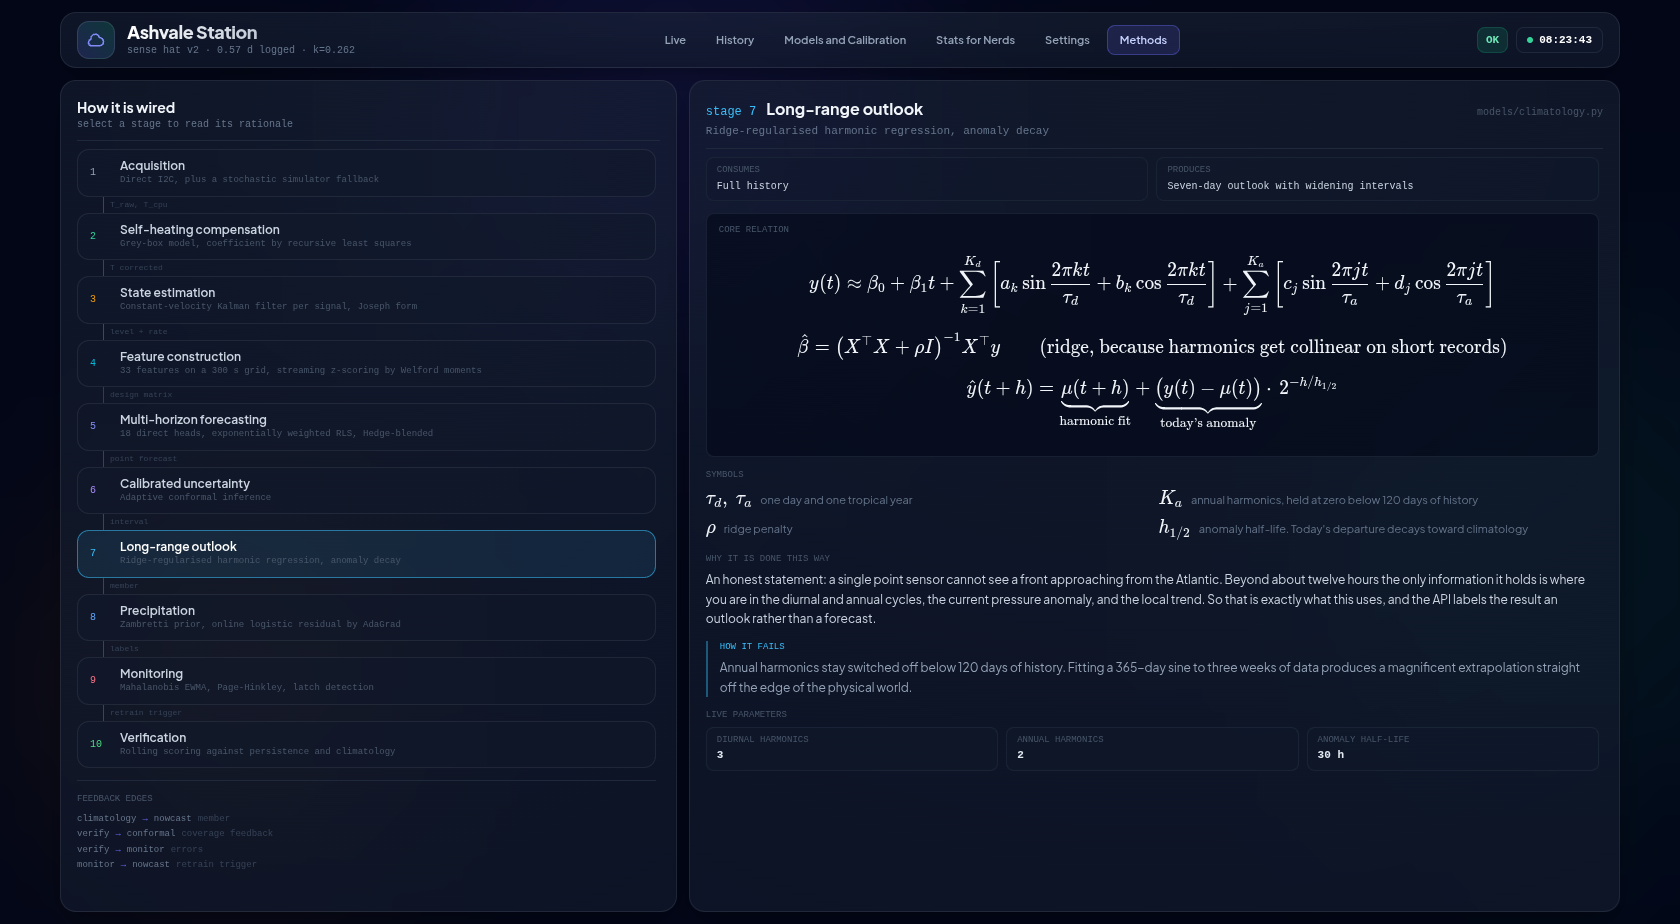
Climatological harmonic regression to capture recurring daily and seasonal structure, while allowing recent anomalies to influence the forecast.
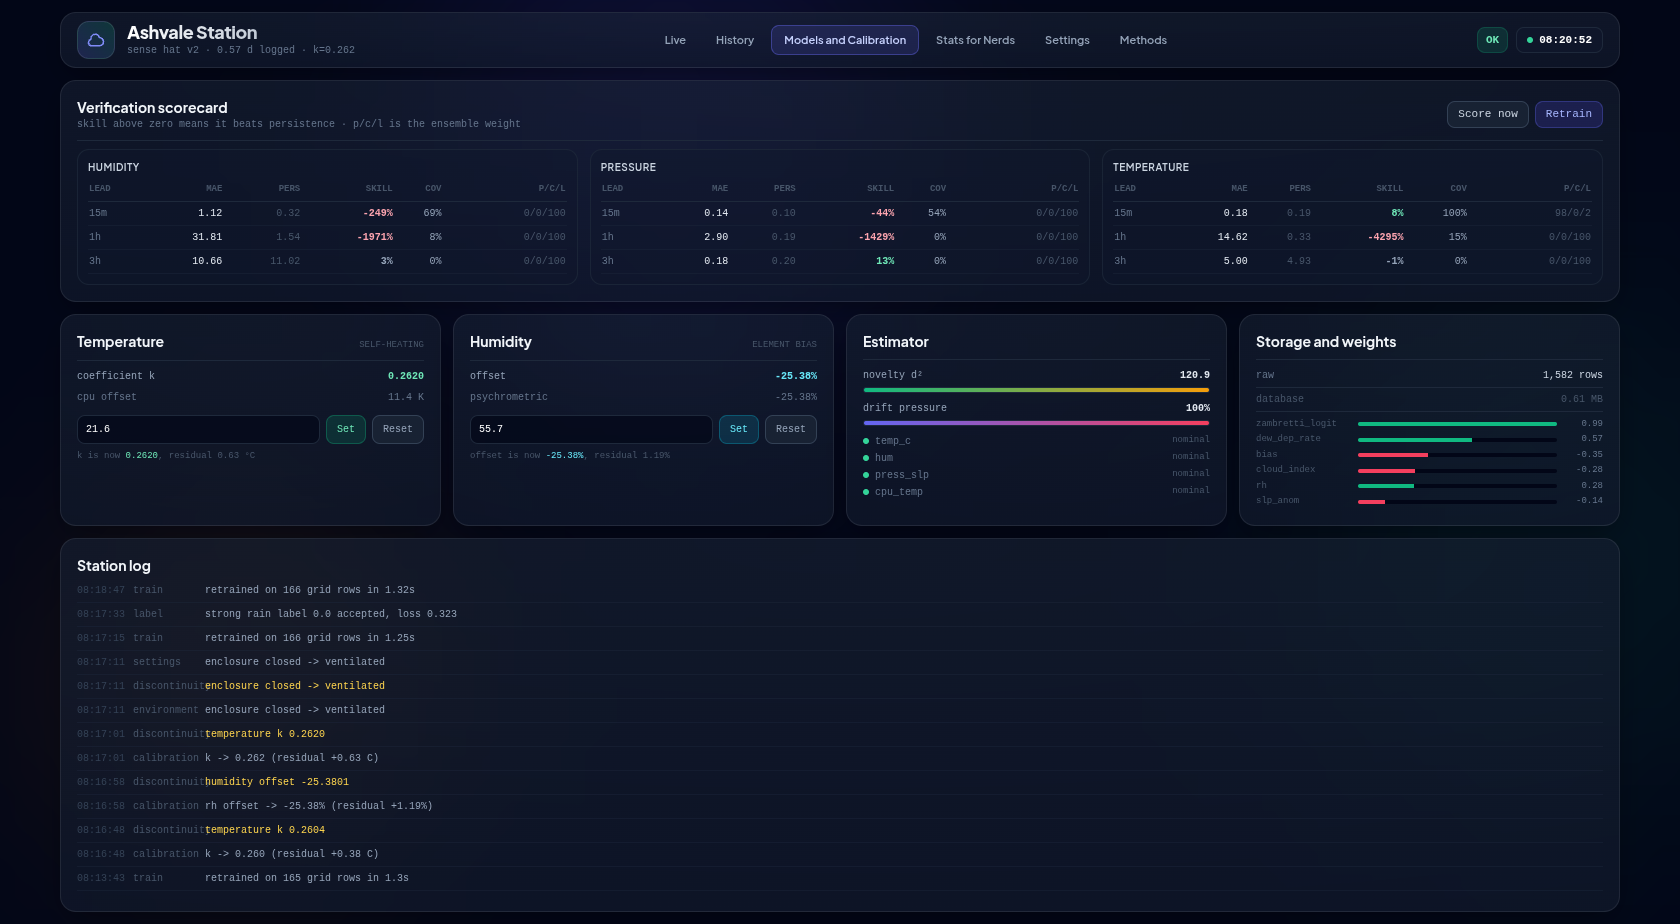
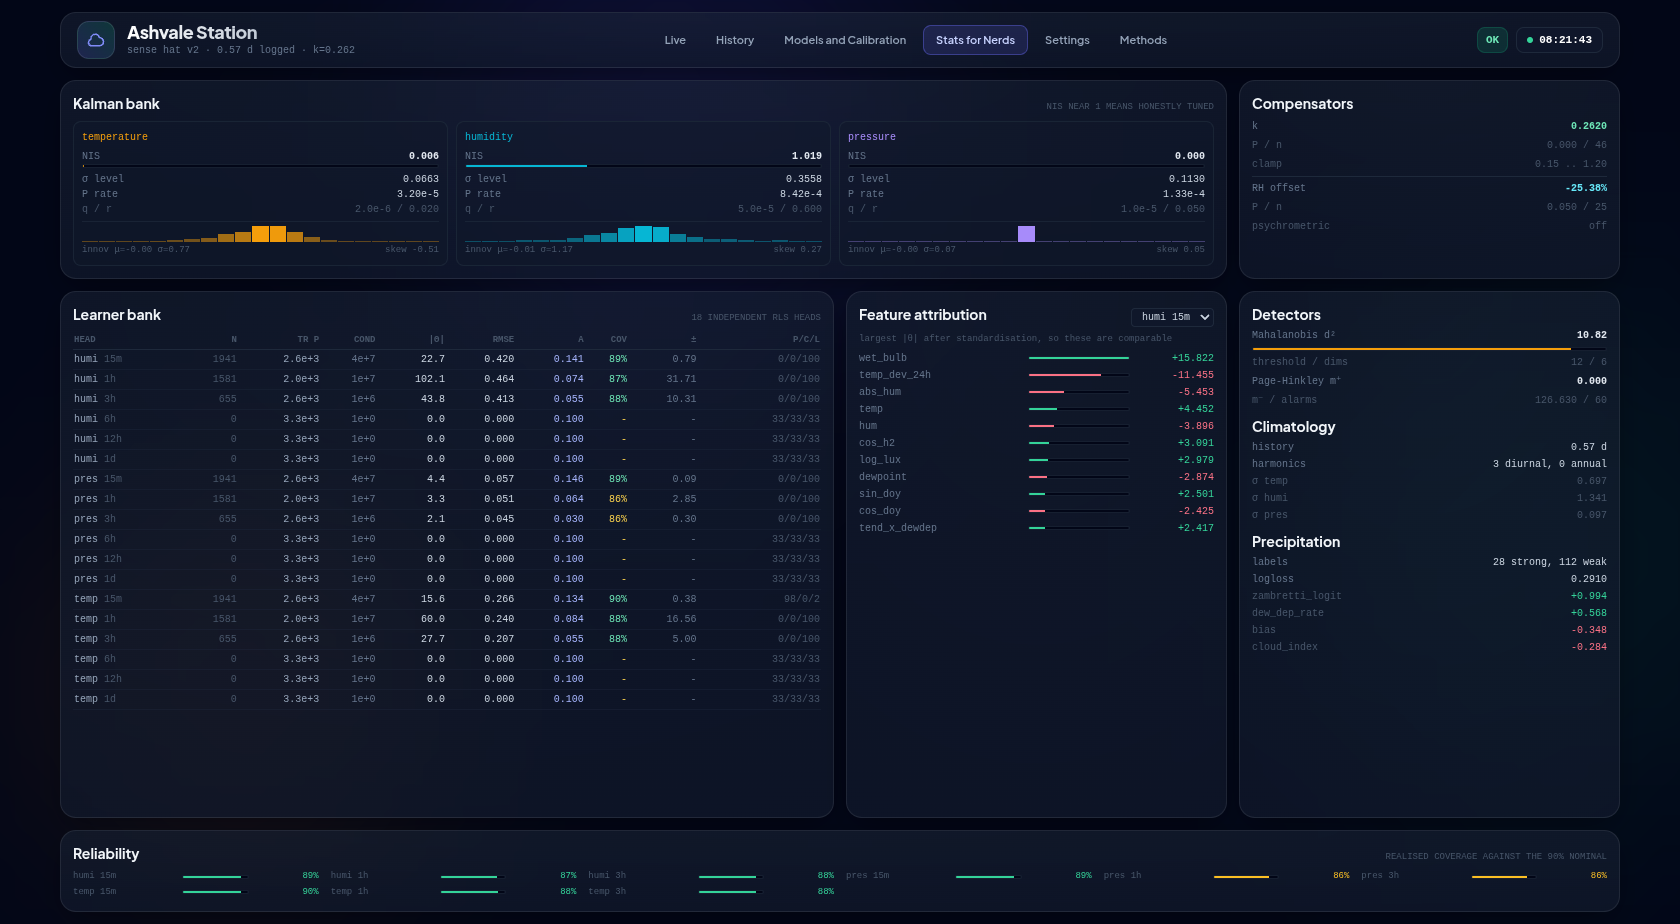
Mahalanobis novelty detection and Page-Hinkley drift detection to recognise when the current environment starts behaving differently from what the model has learned.
And then there is an ensemble layer that learns how much it should trust different forecasting components at different horizons.
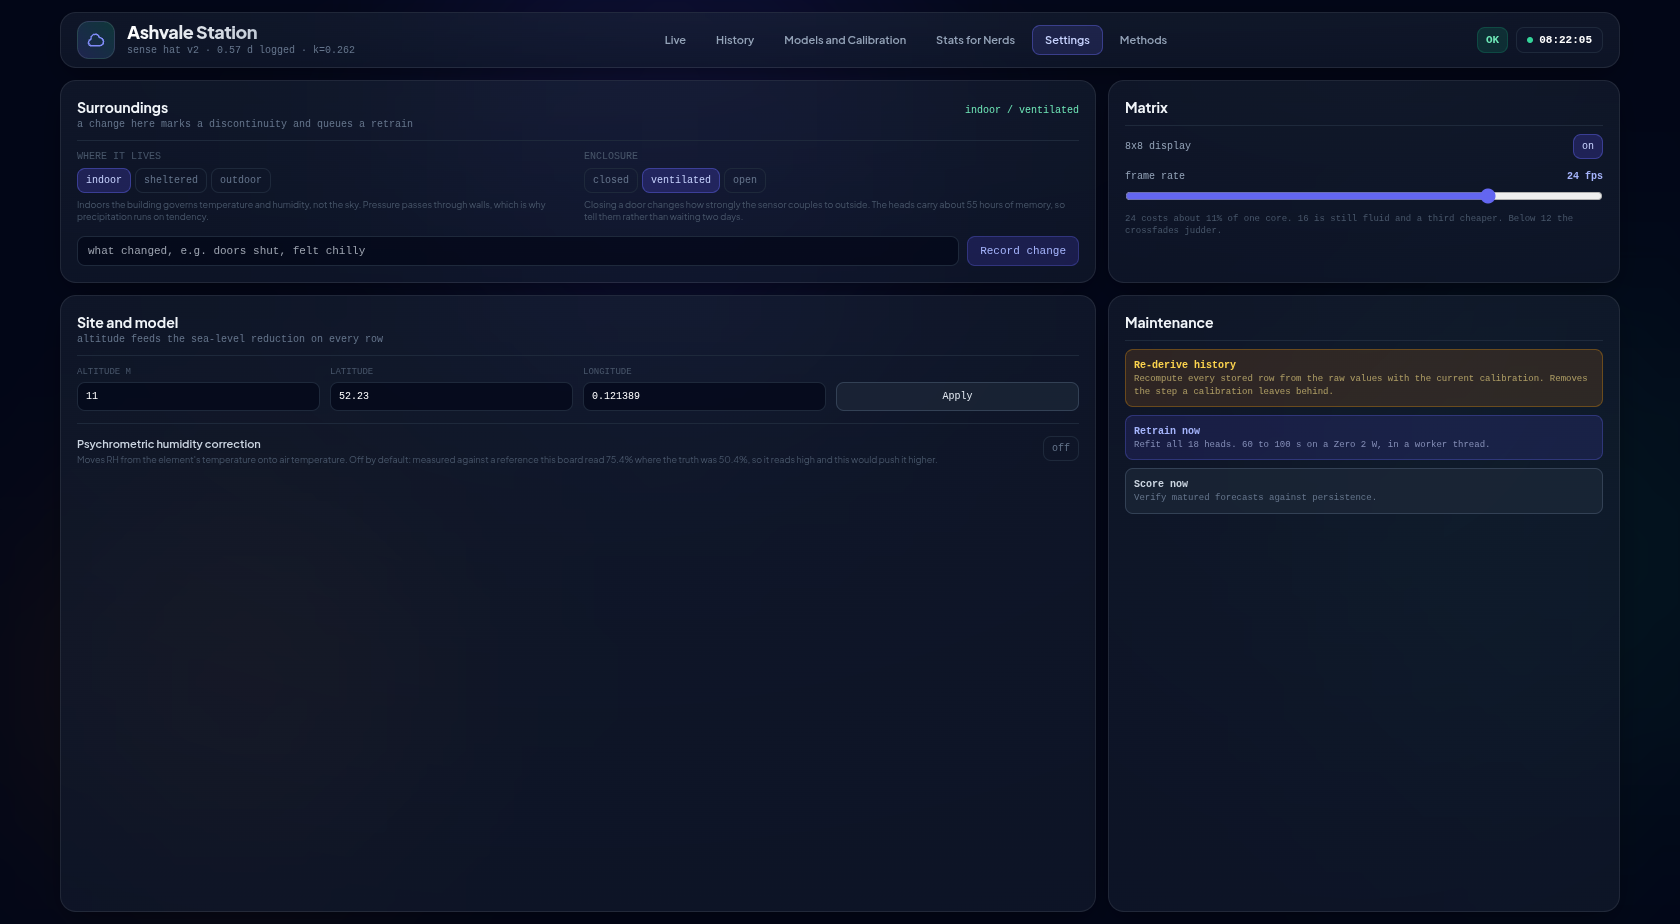
At the moment, the system exposes 18 independent RLS forecasting heads, with 33 standardised features feeding the learners, including feature-level attribution so you can actually inspect what the models are learning rather than treating the prediction as a black box.
The mathematics behind some of this is surprisingly compact.
For example, the temperature channel estimates and continuously updates a self-heating coefficient using recursive least squares. The Kalman layer then tracks both weather level and rate of change while maintaining a covariance estimate. The uncertainty layer adapts its prediction interval based on the observed coverage of previous forecasts.
In other words, the Pi isn’t simply collecting weather data.
It is continuously updating its own little statistical model of the atmosphere around it.
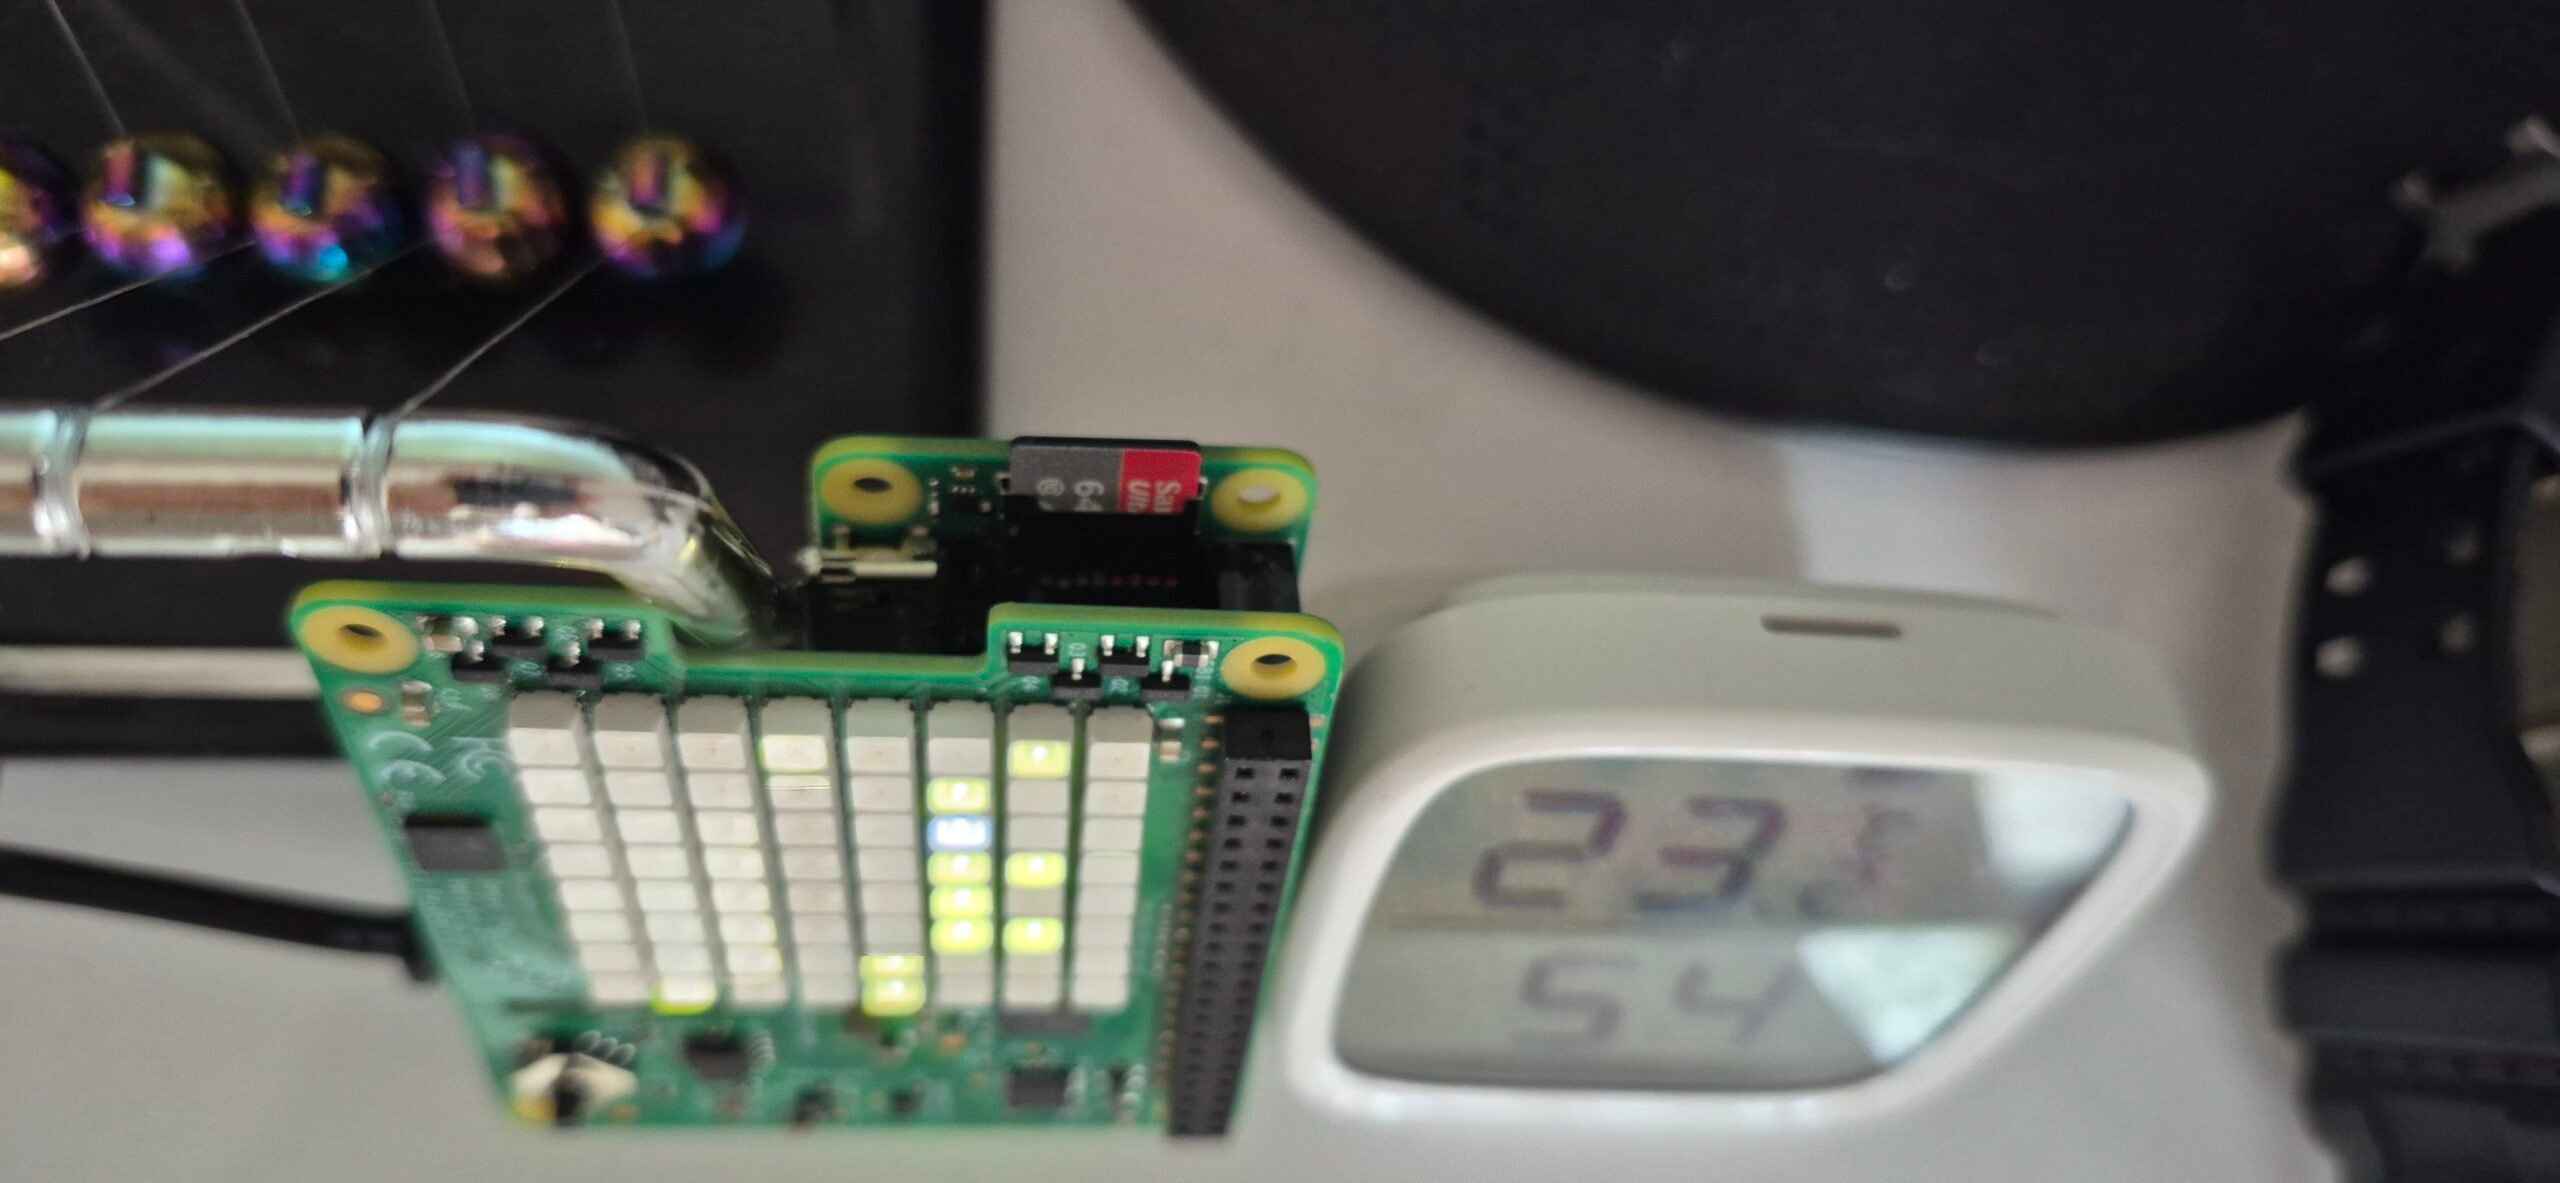
And then I decided the Sense HAT shouldn’t merely display numbers. The 8×8 matrix has become a tiny visual weather instrument.
Pressure tendency drives motion, temperature influences colour, humidity influences contrast, precipitation probability determines rainfall intensity, solar elevation controls the day/night cycle, and the forecast uncertainty itself becomes visible on the display. The renderer uses gamma correction, sub-pixel rendering, crossfades and temporal dithering to squeeze surprisingly rich animation out of just 64 RGB pixels.
So yes…
There is a Raspberry Pi Zero 2 W on my desk, running an adaptive machine-learning forecasting system, doing its own statistics, estimating uncertainty, detecting drift and rendering the results on an 8×8 LED matrix.
And I absolutely love the fact that it does all of this without sending the data to a cloud service or borrowing somebody else’s GPU.
This project is now open source.
I’d genuinely love for people who enjoy machine learning, statistics, embedded systems, Raspberry Pi, meteorology or just wonderfully unnecessary engineering to have a look.
Read the code. Break it. Improve it. Benchmark it. Challenge the assumptions. Add a better model.
And most importantly:
Show me what you can make this tiny machine learn.
Project / GitHub: https://github.com/lynchaos/ashvale-station